
The Web Audio API is a model completely separate from the
What We’re Building
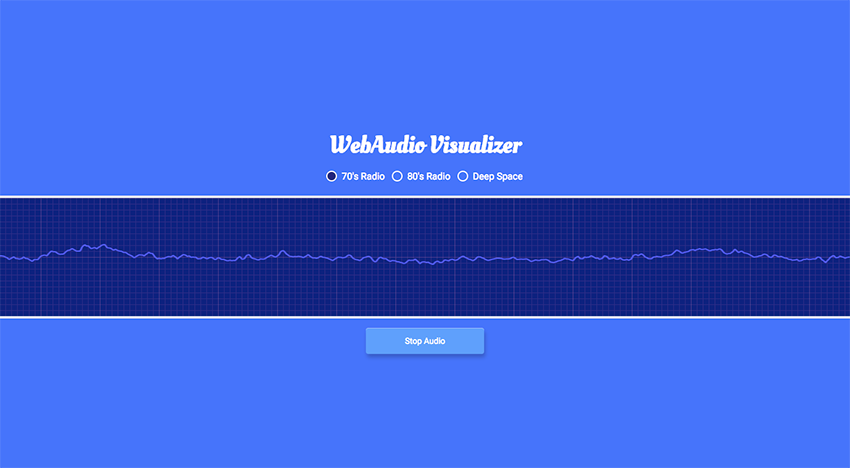
Our demo above contains three radio inputs that when selected will play the correlating audio that each one references. When a channel is selected, our audio will play and the frequency graph will be displayed.
I won’t be explaining every line of the demo’s code; however, I will explain the primary bits that help to display the audio source and its frequency graph. To start, we’ll need a small bit of markup.
The Markup
The most important part of the markup is the canvas, which will be the element that displays our oscilloscope. If you’re not familiar with canvas, I suggest reading this article titled “An Introduction to Working With Canvas.”
With the stage set for displaying the graph, we need to create the audio.
Creating the Audio
We’ll begin by defining a couple of important variables for the audio context and gain. These variables will be used to reference at a later point in the code.
let audioContext,
    masterGain;
The audioContext represents an audio-processing graph (a complete description of an audio signal processing network) built from audio modules linked together. Each is represented by an AudioNode, and when connected together, they create an audio routing graph. This audio context controls both the creation of the node(s) it contains and the execution of the audio processing and decoding.
The AudioContext must be created before anything else, as everything happens inside a context.
Our masterGain accepts an input of one or more audio sources and outputs the audio’s volume, which has been adjusted in gain to a level specified by the node’s GainNode.gain a-rate parameter. You can think of the master gain as the volume. Now we’ll create a function to allow playback by the browser.
function audioSetup() {
    let source = 'http://ice1.somafm.com/seventies-128-aac';
    audioContext = new (window.AudioContext || window.webkitAudioContext)();
}
I begin by defining a source variable that’ll be used to reference the audio file. In this case I’m using a URL to a streaming service, but it could also be an audio file. The audioContext line defines an audio object and is the context we discussed prior. I also check for compatibility using the WebKit prefix, but support is widely adopted at this time with the exception of IE11 and Opera Mini.
function audioSetup() {
    masterGain = audioContext.createGain();
    masterGain.connect(audioContext.destination);
}
With our initial setup complete, we’ll need to create and connect the masterGain to the audio destination. For this job, we’ll use the connect() method, which allows you to connect one of the node’s outputs to a target.
function audioSetup() {
    let song        = new Audio(source),
        songSource  = audioContext.createMediaElementSource(song);

    songSource.connect(masterGain);
    song.play();
}
The song variable creates a new audio object using the Audio() constructor. You’ll need an audio object so the context has a source to playback for listeners.
The songSource variable is the magic sauce that plays the audio and is where we’ll be passing in our audio source. By using createMediaElementSource(), the audio can be played and manipulated as desired. The final variable connects our audio source to the master gain (volume). The final line song.play() is the call to actually give permission to play the audio.
let audioContext,
    masterGain;

function audioSetup() {
    let source = 'http://ice1.somafm.com/seventies-128-aac';

    audioContext = new (window.AudioContext || window.webkitAudioContext)();
    masterGain = audioContext.createGain();
    masterGain.connect(audioContext.destination);

    let song        = new Audio(source),
        songSource  = audioContext.createMediaElementSource(song);

    songSource.connect(masterGain);
    song.play();
}

audioSetup();
Here’s our final result containing all the lines of code we’ve discussed up to this point. I also make sure to make the call to this function written on the last line. Next, we’ll create the audio wave form.
Creating the Audio Wave
In order to display the frequency wave for our chosen audio source, we need to create the wave form.
const analyser = audioContext.createAnalyser();
masterGain.connect(analyser);
The first reference to createAnalyser() exposes the audio time and frequency data in order to generate data visualizations. This method will produce an AnalyserNode that passes the audio stream from the input to the output, but allows you to acquire the generated data, process it, and construct audio visualizations that have exactly one input and one output. The analyser node will be connected to master gain that is the output of our signal path and gives the ability to analyze a source.
const waveform = new Float32Array(analyser.frequencyBinCount);
analyser.getFloatTimeDomainData(waveform);
This Float32Array() constructor represents an array of a 32-bit floating point number. The frequencyBinCount property of the AnalyserNode interface is an unsigned long value half that of the FFT (Fast Fourier Transform) size. This generally equates to the number of data values you will have for use with the visualization. We use this approach to collect our frequency data repeatedly.
The final method getFloatTimeDomainData copies the current waveform, or time-domain data, into a Float32Array array passed into it.
function updateWaveform() {
  requestAnimationFrame(updateWaveform);
  analyser.getFloatTimeDomainData(waveform);
}
This entire amount of data and processing uses requestAnimationFrame() to collect time domain data repeatedly and draw an “oscilloscope style” output of the current audio input. I also make another call to getFloatTimeDomainData() since this needs to be continually updated as the audio source is dynamic.
const analyser = audioContext.createAnalyser();
masterGain.connect(analyser);

const waveform = new Float32Array(analyser.frequencyBinCount);
analyser.getFloatTimeDomainData(waveform);

function updateWaveform() {
  requestAnimationFrame(updateWaveform);
  analyser.getFloatTimeDomainData(waveform);
}
Combining all the code discussed thus far results in the entire function above. The call to this function will be placed inside our audioSetup function just below song.play(). With the wave form in place, we still need to draw this information to the screen using our canvas element, and this is the next part of our discussion.
Drawing the Audio Wave
Now that we’ve created our waveform and possess the data we require, we’ll need to draw it to the screen; this is where the canvas element is introduced.
function drawOscilloscope() {
    requestAnimationFrame(drawOscilloscope);
    const scopeCanvas = document.getElementById('oscilloscope');
    const scopeContext = scopeCanvas.getContext('2d');
}
The code above simply grabs the canvas element so we can reference it in our function. The call to requestAnimationFrame at the top of this function will schedule the next animation frame. This is placed first so that we can get as close to 60FPS as possible.
function drawOscilloscope() {
    scopeCanvas.width = waveform.length;
    scopeCanvas.height = 200;
}
I’ve implemented basic styling that will draw the width and height of the canvas. The height is set to an absolute value, while the width will be the length of the wave form produced by the audio source.
function drawOscilloscope() {
  scopeContext.clearRect(0, 0, scopeCanvas.width, scopeCanvas.height);
  scopeContext.beginPath();
}
The clearRect(x, y, width, height) method will clear any previously drawn content so we can continually draw the frequency graph. You’ll also have to make sure to call beginPath() before starting to draw the new frame after calling clearRect(). This method starts a new path by emptying the list of any and all sub-paths. The final piece in this puzzle is a loop to run through the data we’ve obtained so we can continually draw this frequency graph to the screen.
function drawOscilloscope() {
    for(let i = 0; i < waveform.length; i++) {
        const x = i;
        const y = ( 0.5 + (waveform[i] / 2) ) * scopeCanvas.height;

        if(i == 0) {
            scopeContext.moveTo(x, y);
        } else {
            scopeContext.lineTo(x, y);
        }
    }

    scopeContext.stroke();
}
This loop above draws our wave form to the canvas element. If we log the wave form length to the console (while playing the audio), it will report 1024 repeatedly. This generally equates to the number of data values you'll have to play with for the visualization. If you recall from the previous section for creating the wave form, we get this value from Float32Array(analyser.frequencyBinCount). This is how we're able to reference the 1024 value we'll be looping through.
The moveTo() method will literally move the starting point of a new sub-path to the updated (x, y) coordinates. The lineTo() method connects the last point in the sub-path to the x, y coordinates with a straight line (but does not actually draw it). The final piece is calling stroke() provided by canvas so we can actually draw the frequency line. I'll leave the portion containing the math as a reader challenge, so make sure to post your answer in the comments below.
function drawOscilloscope() {
    requestAnimationFrame(drawOscilloscope);

    const scopeCanvas = document.getElementById('oscilloscope');
    const scopeContext = scopeCanvas.getContext('2d');

    scopeCanvas.width = waveform.length;
    scopeCanvas.height = 200;

    scopeContext.clearRect(0, 0, scopeCanvas.width, scopeCanvas.height);
    scopeContext.beginPath();

    for(let i = 0; i < waveform.length; i++) {
        const x = i;
        const y = ( 0.5 + (waveform[i] / 2) ) * scopeCanvas.height;

        if(i == 0) {
            scopeContext.moveTo(x, y);
        } else {
            scopeContext.lineTo(x, y);
        }
    }

    scopeContext.stroke();
}
This is the entire function we've created to draw the wave form that we'll call after song.play() placed within our audioSetup function, which also includes our updateWaveForm function call as well.
Parting Thoughts
I've only explained the important bits for the demo, but make sure to read through the other portions of my demo to gain a better understanding of how the radio buttons and the start button work in relation to the code above, including the CSS styling.
The Web Audio API is really fun for anyone interested in audio of any kind, and I encourage you to go deeper. I've also collected some really fun examples from CodePen that use the Web Audio API to build some really interesting examples. Enjoy!
- https://codepen.io/collection/XLYyWN
- https://codepen.io/collection/nNqdoR
- https://codepen.io/collection/XkNgkE
- https://codepen.io/collection/ArxwaW
References
- http://webaudioapi.com
- https://webaudio.github.io/web-audio-api
- http://chimera.labs.oreilly.com/books/1234000001552/ch01.html
Powered by WPeMatico

