In this tutorial, you’ll learn how to visualize data by taking advantage of the DataTables.js and Highcharts.js JavaScript libraries.
Here’s what we’re going to build (check out the larger version for a better experience):
Required Libraries
For the purposes of this example, we’ll have to load the following libraries in our pen:
jQuery
DataTables.js
Highcharts.js
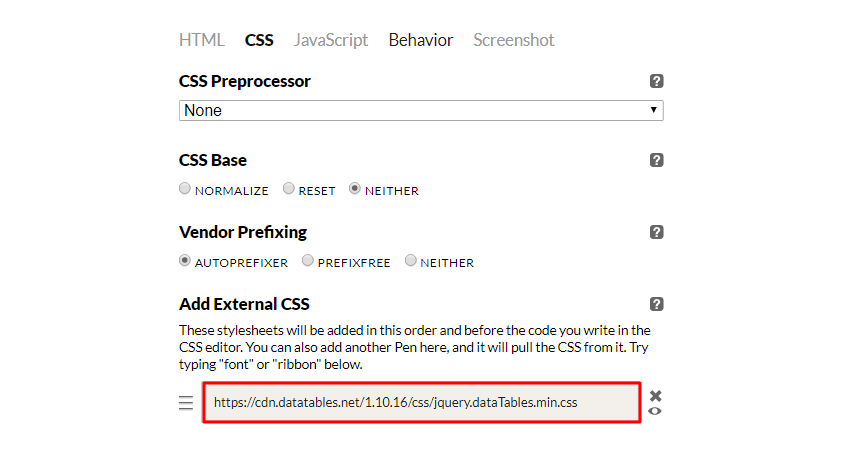
With that in mind, if you look under the Settings tab, you’ll see that I’ve included one external CSS file:
In the same way, I’ve also included four external JavaScript files:
Note: we had to add jQuery to our project because DataTables.js is a jQuery plugin. However, keep in mind that Highcharts.js is a pure JavaScript library, and thus doesn’t require jQuery.
The HTML
To kick things off we define an element with the class of container which contains two sub-elements:
A table with 26 rows. The first row refers to the table headers th, while the other 25 rows carry country details. The source of our data for this example is worldometers.info.
An empty div which will hold the chart.
Here’s the HTML structure:
Country
Population (2017)
Density (P/Km²)
Med. Age
China
1,409,517,397
150
37
It’s worth mentioning that, for the sake of simplicity, we’ve specified the aforementioned hard-coded table data. In a real project though, the table might be created dynamically.
With the markup ready, and a background color added for clarity, the project looks like this:
The CSS
At this point, we define some basic styles, like so:
The #dt-table_wrapper doesn’t exist in our markup. It’s added by the DataTables as soon as we initialize it.
While we define a few basic rules for small screens, note that the demo won’t be fully responsive. There are a lot of things we can do to make the table and chart look better on small screens. For example, for DataTables there’s a Responsive extension available, but that’s beyond the scope of this tutorial.
With the CSS in place, let’s see how the project looks. We won’t see a big difference yet because we haven’t initialized the libraries:
The JavaScript
Now for the JavaScript window in our pen. When the DOM is ready, the init function is executed; this function triggers other sub-functions:
As you’ll see, each of these sub-functions accomplishes a certain task.
Initializing DataTables
The first step is to convert our table into a “DataTables” table. We can do this with just one line of code: $(“#dt-table”).DataTable();
If we now look at the table, we’ll notice that it has adopted the capabilities of a DataTables table, ie: we can sort it, search it, and so on. Have a play with it in the following demo:
Now, as you can see, DataTables applies a default sorting to the table. If needed, we can customize this behavior.
Extracting Table Data
The next step is to grab the table data and build the chart. We don’t want all the table data. In fact, if you look back at the finished version of our demo, you’ll notice that the chart only contains data from the first three columns (Country, Population, Density).
With that in mind, in order to retrieve the required data, we’ll take advantage of the DataTables API. The function responsible for this behavior is the following one:
function getTableData(table) {
const dataArray = [],
countryArray = [],
populationArray = [],
densityArray = [];
// loop table rows
table.rows({ search: "applied" }).every(function() {
const data = this.data();
countryArray.push(data[0]);
populationArray.push(parseInt(data[1].replace(/,/g, "")));
densityArray.push(parseInt(data[2].replace(/,/g, "")));
});
// store all data in dataArray
dataArray.push(countryArray, populationArray, densityArray);
return dataArray;
}
Inside this function, we iterate through the table rows and for each row, we grab the target column data and store them in the associated arrays. Finally, all those arrays are stored inside another array.
Here’s a quick visualization of the master (i.e. dataArray) array:
Before moving on, it’s important to understand one thing. By default, the getTableData function should collect data from all the table rows. But then, if we search the table for something specific, only the rows that match should be collected and processed. To accomplish these things, we pass an argument to the rows function. Specifically, an object with the search: "applied" property value.
Again note that if we don’t pass this object, we’ll always collect data from all the table rows (test it). For more information about the properties that we can pass to this object, be sure to look at this page.
Building the Chart
Now that we have the desired data, we’re ready to build the chart. This will contain two nested charts, one Column chart and one Spline chart.
Don’t be overwhelmed by the code above! Without doubt the best way to understand how it works is to try it. Plus, you should definitely read the documentation. Anyhow, let’s briefly highlight the key concepts:
The x-axis contains all the countries.
We define two y-axes. The first one holds all the population values, while the second one includes all the available densities.
If our chart doesn’t contain any data a message appears. Note that we’re able to customize the message text through the lang object.
With the charts in place, let’s again look at our progress:
Synchronizing the Table and Charts
In the previous section, we built the chart based on the table data, but there’s still no full synchronization between the table and chart. To prove it, go back to the last demo and change the ordering (sorting) of the table, or search for something. You’ll notice that the chart doesn’t react to table changes.
To fix this, we’ll take advantage of the DataTables draw event. This event fires each time the table gets updated. So as soon as we modify the table we should recollect the table data and reconstruct the chart.
Here’s the tricky thing though. The draw event also fires during the table pagination; there’s no reason to rebuild the chart during this process. Ideally, we should prevent this behavior. Thankfully, there’s the page event which helps us accomplish this task.
Here’s the code that implements the desired functionality:
let draw = false;
function setTableEvents(table) {
// listen for page clicks
table.on("page", () => {
draw = true;
});
// listen for updates and adjust the chart accordingly
table.on("draw", () => {
if (draw) {
draw = false;
} else {
const tableData = getTableData(table);
createHighcharts(tableData);
}
});
}
Now that both table and chart are synchronized, if we make a “bad” search, we’ll see the following messages:
The final version of our project:
Browser Support
Both plugins have great browser support (DataTables support, Highcharts support), so you can expect that this demo will work well in all recent browsers.
Again keep in mind that this demo isn’t optimized for small screens.
Lastly, as usual, we use Babel to compile the ES6 code down to ES5.
Conclusion
That’s it folks! We managed to visualize our data by combining two popular and powerful JavaScript libraries.
Now that you’re familiar with the process, go ahead and elaborate the functionality of the final demo. For instance, try to add custom filters to the table.
As always, if you have any questions or if there’s anything else you would like to see as a next step to this tutorial, let me know in the comments below.
This website uses cookies to improve your experience. AcceptRead More
Privacy & Cookies Policy
Privacy Overview
This website uses cookies to improve your experience while you navigate through the website. Out of these, the cookies that are categorized as necessary are stored on your browser as they are essential for the working of basic functionalities of the website. We also use third-party cookies that help us analyze and understand how you use this website. These cookies will be stored in your browser only with your consent. You also have the option to opt-out of these cookies. But opting out of some of these cookies may affect your browsing experience.
Necessary cookies are absolutely essential for the website to function properly. This category only includes cookies that ensures basic functionalities and security features of the website. These cookies do not store any personal information.
Any cookies that may not be particularly necessary for the website to function and is used specifically to collect user personal data via analytics, ads, other embedded contents are termed as non-necessary cookies. It is mandatory to procure user consent prior to running these cookies on your website.


 Medianic has done a outstanding job in creating our company website in such a short time at unbeatable prices, rovtec marine services recommended Medianic for their superior skill in Web design, thank you outstanding job!RovtechWeb Design