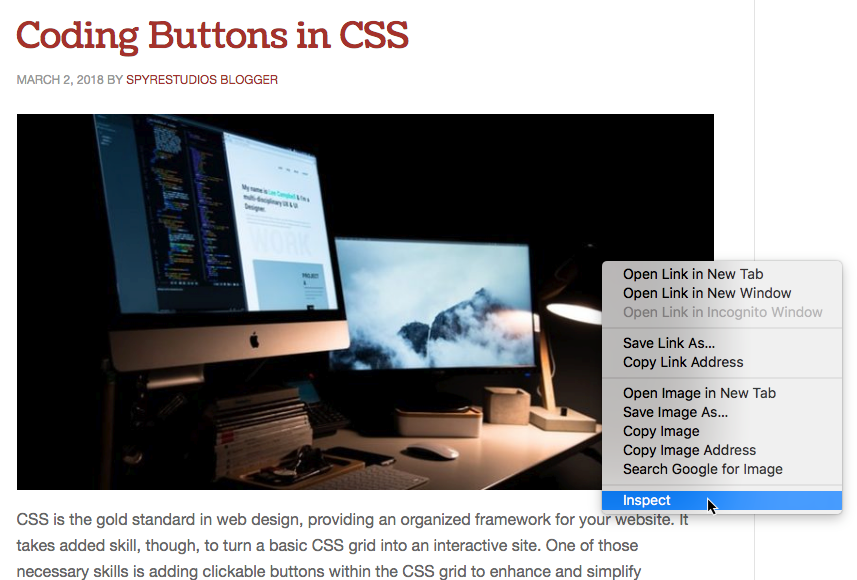
Google Chrome is one of the best consumer browsers on the market, but it also contains a number of powerful developer tools. We can reveal some of these tools with Chrome’s Inspect Element (or “Inspect”) tool. This developer tool provides insight into how websites are constructed and styled, and it can help you debug your own sites.
Accessing the Inspect Element Tool
The Inspect tool, also known as the Inspect Element tool, is highly useful for analyzing websites. You can access it through Chrome’s context menu.
Right click on any element in your browser and choose “Inspect” in the context menu. You can also press Option-Command-I on a Mac or Control-Shift-I on Windows to open the Chrome developer tools window.

The window that pops out is the DevTools panel. This panel has used for a number of features. The default and most obvious tool is the Elements pane. This will show the HTML for the element you right-clicked and reveal the element’s style rules in the panes below.

The panel has a lot going on. Let’s look at each component of the developer tool’s pane.
Inspecting the Inspector
The inspect element panel is divided into several different tabs which are visible at the top of the window. We’ll focus on the default Elements tab, which shows the page’s HTML structure and CSS styling rules.
There are two useful buttons next to these tabs. The first is the Inspect Element tool.

This tool allows you to mouse over and select different DOM elements to inspect. Click the button, the click on or hover over an element to highlight and scroll to its HTML and CSS.

Testing Responsive Design
The second button turns on Device Preview mode. In this mode you can see what your webpage looks like at different resolutions and screen sizes.

If you click on that button, you’ll see your webpage snap into a new viewport. This will mimic the window a mobile device, letting you preview your responsive elements’ behaviors.

You can then use the drop-down menu above the page preview or the handles on the sides of the page preview to resize the device preview window. Choose from the presets to select popular device dimensions, or manually adjust the viewport size and save your own presets.

You can also test out how functional your site will be on poor Internet connections. Click the “online” drop down to simulate lower-quality connections and refresh your page to see the results.

Finally, you can rotate the viewport into landscape view with the Rotate icon at the far right.
Examining Your HTML
The primary pane in the Element panel is the HTML pane, which shows your site’s HTML.

This pane is like a super-powered “View Source.” It’s layout is based on the DOM, with elements nested inside their containers. Click on the disclosure triangles to collapse and reveal elements quickly.
The element you inspected when you opened the window is automatically highlighted. Here, I’ve inspected an image which is contained in a link. As expected, I see a highlighted image tag within an anchor tag.

If you look at the bottom of this window, you’ll see what looks like a file path.

This is called the breadcrumb trail. It shows all the parent elements of the inspected element. Click on an element in the breadcrumb trail to quickly navigate to it.
Editing Your HTML with Inspect Element
In many of the Chrome developer tools, elements can be edited by clicking or double-clicking on them.
HTML elements can be live-edited in this window. Double-click on any tag or property to open it in a text box. This will allow you to temporarily edit the page’s code. Edits will be cleared once you close the page. It’s a great way to quickly troubleshoot your HTML or try out alternative code.

If you want to edit the whole line, or you just want a bigger text box, click the three dots to the left of any line of HTML. This will reveal the context menu. Choose “Edit as HTML” from the list to get a multi-line edit box for the whole element.


From the context menu, you can also delete elements, copy code or add a single attribute or property to your code. With this tool, you can copy any code you’ve changed and paste it into your text editor or WYSIWYG program.

Viewing and Editing CSS
Underneath the HTML view is a pane that showing the CSS rules that apply to our element. This is the Styles pane. From here, we can view or editing CSS rules.

Toggle a rule on or off by hovering over it and clicking the check box next to the rule.

You can also click directly on a rule to live edit its name or value. Any changes you make will effect the page immediately.
![]()
You can also search for particular rules using the Filter search box.

The Styles pane makes debugging and viewing CSS a lot easier, and it can do even more. Check out Google’s documentation for a full explanation of the Style pane’s other functions. You can even practice editing CSS with Google’s CSS developer tools tutorial.
Box Model and Computed Style
Next to the style view is diagram representing the box model for the selected element.

The selected element is blue. It’s padding is green, borders are yellow and margins are orange. Hover over any one part of the box model to see the corresponding element highlighted on the webpage.
 Measurements are written on each elements. The element I’ve selected here is 698 pixels by 377.297 pixels (it’s resized responsively). Since there’s no padding or border, those boxes are blank. There’s a right margin of 24 pixels and a bottom margin of 16 pixels, as seen.
Below the box model is a list of all the styling rules that actually apply to this particular element. This only shows the rules actually effecting the element. Any rules that are deprecated or superseded are left off. This is called the “computed style” of the object, and it’s the combined result of your CSS.

As in the Styles pane, you can search for particular rules by typing in the Filter box. This will filter the computed rules only.

Conclusion
Chrome’s developer tools are invaluable for any professional developer. In future posts, we’ll be looking at the other panes of Chrome’s developer tools, including the Console and Performance tabs. If you want more background on all that the Chrome developer tools, can do, Google’s own documentation is thorough and useful.
You might also like the following posts:
The Powerful JavaScript Debugger You Never Knew You Had
How to Build a Chrome Extension
10 Chrome Addons Every Dev Should Have
The post Getting Started with Chrome Developer Tools: Inspect Element appeared first on SpyreStudios.
Powered by WPeMatico


