Data visualization is a way to understand large chunks of data. Certain trends and patterns might go unnoticed in text based format, so data visualization makes it easier to understand what the data is trying to say by visualizing it using different charts.
From the official documentation,
plotly.py is an interactive, browser-based graphing library for Python. Built on top of plotly.js, plotly.py is a high-level, declarative charting library. plotly.js ships with over 30 chart types, including scientific charts, 3D graphs, statistical charts, SVG maps, financial charts, and more.
In this tutorial, you’ll be learning about a data visualization tool called Plotly. You’ll learn how to visualize data in Python using Plotly.
Getting Started
You’ll be using a Python framework called Flask to create a Python web application. Once you have the application started you’ll see how to use the Plotly library to visualize data.
Setting Up The Flask Web App
Flask is a micro framework for creating web applications using Python. It is quite easy to set up Flask. Install Flask using PIP.
pip install flask
Create a directory called PythonPlot. Navigate to the directory and create a file called app.py.
mkdir PythonPlot
cd PythonPlot
Add the following code to the app.py file.
from flask import Flask
app = Flask(__name__)

@app.route("/")
def hello():
    return "Welcome to TutsPlus!"
Start the web application server using the following code:
FLASK_APP=app.py flask run
Point your browser to http://localhost:5000/ and you will have the web application running with the welcome message.
Now let’s try render an HTML page from your flask web application.
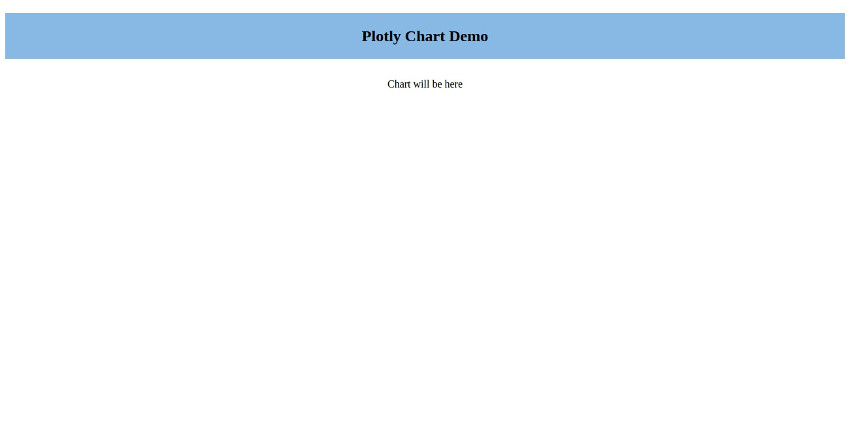
Create a folder called templates and inside the templates folder create a file called index.html. You’ll be rendering the graphs created using plotly in index.html file.
Add the following HTML code to templates/index.html file.
Plotly Chart Demo
Chart will be here
Import render_template inside the app.py file.
from flask import Flask, render_template
Add a new route called showLineChart inside the app.py file. Here is how it looks:
@app.route('/showLineChart')
def line():
    return render_template('index.html')
Save the above changes and restart the server. Point your browser to http://localhost:5000/showLineChart and you will have the page rendered in your browser.

Creating Line Chart Using Plotly
Let’s get started with creating line chart using Plotly. Import the plotly-related libraries in the app.py file.
import plotly
import plotly.plotly as py
import plotly.graph_objs as go
You’ll be using Numpy to generate random data for displaying inside the line chart. Import Numpy in the app.py file.
import numpy as np
You’ll be using the numpy.linspace method to create evenly spaced samples calculated over the interval.
count = 500
xScale = np.linspace(0, 100, count)
The above code creates 500 evenly spaced samples between 0 and 100 for the x axis scale.
You can use numpy.random.randn for creating random samples for y axis scale.
yScale = np.random.randn(count)
Create a trace using plotly.graph_objs.scatter method.
trace = go.Scatter(
    x = xScale,
    y = yScale
)
You need to convert the trace into JSON format. For that you’ll make use of the plotly json encoder plotly.utils.PlotlyJSONEncoder.
data = [trace]
graphJSON = json.dumps(data, cls=plotly.utils.PlotlyJSONEncoder)
Once you have the json data you’ll pass it to the template file to be rendered.
return render_template('index.html',
    graphJSON=graphJSON)
Here is how the app.py file looks:
from flask import Flask, render_template
import json
import plotly
import plotly.plotly as py
import plotly.graph_objs as go

import numpy as np

app = Flask(__name__)

@app.route('/showLineChart')
def line():
    count = 500
	xScale = np.linspace(0, 100, count)
	yScale = np.random.randn(count)

	# Create a trace
	trace = go.Scatter(
	    x = xScale,
	    y = yScale
	)

	data = [trace]
	graphJSON = json.dumps(data, cls=plotly.utils.PlotlyJSONEncoder)
	return render_template('index1.html',
	                           graphJSON=graphJSON)
You need to handle the JSON data on the client side to render the chart data. In the templates/index.html file add references to the following scripts:
As seen in the above code, you have referenced the plotly script, as well as jQuery and D3.js which are also required for plotly to work.
Add the following script to parse the passed in JSON and render the chart.
var graphs = {{graphJSON | safe}};
Plotly.plot('chart',graphs,{});
The safe filter explicitly marks the the string as safe, hence disabling auto escaping. Once the JSON is parsed into the graph variable, you have passed it to the plotly plot method along with the ID of the div in which to render the line chart.
Here is how the index.html file looks:
Plotly Chart Demo
Save the above changes and restart the server. Point your browser to http://localhost:5000/showLineChart and you will have the line chart rendered.

Creating a Multi Line Chart Using Plotly
With some modifications to the above created line chart you can convert it into a multi-line chart. For creating a mutli line chart you need to add extra y axis scales.
Let’s start by creating a new route for displaying the mutli line chart.
@app.route('/showMultiChart')
def multiLine():
Create an X axis scale like you did while creating the line chart and add three y axis scales.
count = 500
xScale = np.linspace(0, 100, count)
y0_scale = np.random.randn(count)
y1_scale = np.random.randn(count)
y2_scale = np.random.randn(count)
Create traces using the above xScale and each of the of the y scales.
trace0 = go.Scatter(
    x = xScale,
    y = y0_scale
)
trace1 = go.Scatter(
    x = xScale,
    y = y1_scale
)
trace2 = go.Scatter(
    x = xScale,
    y = y2_scale
)
Convert the data into JSON using the plotly json encoder like you did while creating a single line chart.
data = [trace0, trace1, trace2]
graphJSON = json.dumps(data, cls=plotly.utils.PlotlyJSONEncoder)
return render_template('index.html',
                       graphJSON=graphJSON)
Here is how the /showMultiChart routing looks like:
@app.route('/showMultiChart')
def multiLine():
    count = 500
    xScale = np.linspace(0, 100, count)
    y0_scale = np.random.randn(count)
    y1_scale = np.random.randn(count)
    y2_scale = np.random.randn(count)

    # Create traces
    trace0 = go.Scatter(
        x = xScale,
        y = y0_scale
    )
    trace1 = go.Scatter(
        x = xScale,
        y = y1_scale
    )
    trace2 = go.Scatter(
        x = xScale,
        y = y2_scale
    )
    data = [trace0, trace1, trace2]
    graphJSON = json.dumps(data, cls=plotly.utils.PlotlyJSONEncoder)
    return render_template('index1.html',
                           graphJSON=graphJSON)
Save the above changes and restart the server. Point your browser to http://localhost:5000/showMultiChart and you will have the multi-line chart rendered.

Wrapping It Up
In this tutorial, you saw how to get started with creating line and multi line chart in Python using the Plotly library. You created a Python Flask web app and saw how to create a line chart using the sample data generated using the Numpy library.
You can do a lot more using Plotly. For a detailed information I would recommend reading the official documentation.
Source code from this tutorial is available in the tutorial GitHub repo.
How was you experience learning to create chart using Plotly? Do let us know your thoughts and suggestions in the comments below.
Powered by WPeMatico


